Market sessionsimage
Market sessions
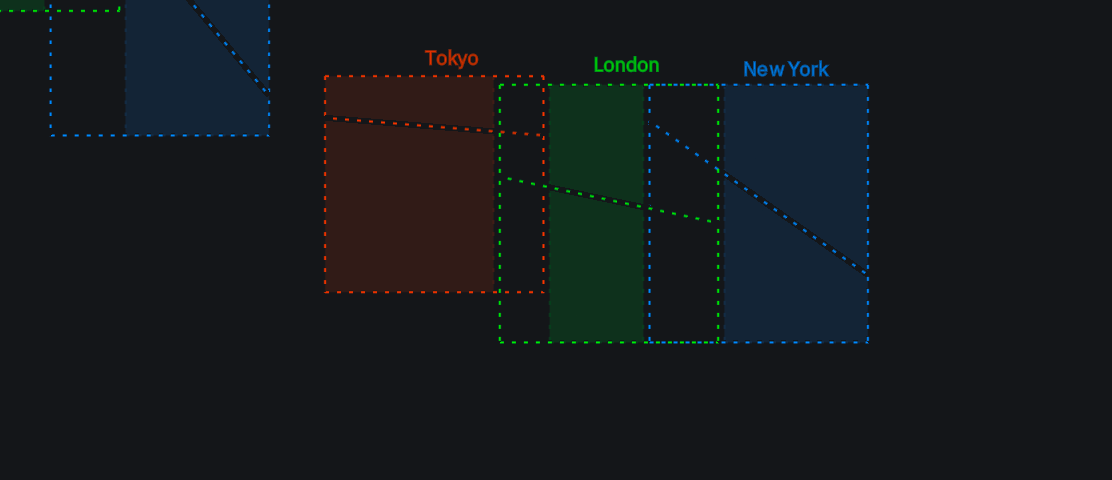
1. OVERVIEW Market Sessions plots the four major global trading sessions (Tokyo, London, New York and Sydney) directly on an intraday chart. Each session is drawn from its open to its close and covers only that session’s own price range (its highest high…
/indicator/market-sessions-53
SM ENTRYimage
SM ENTRY
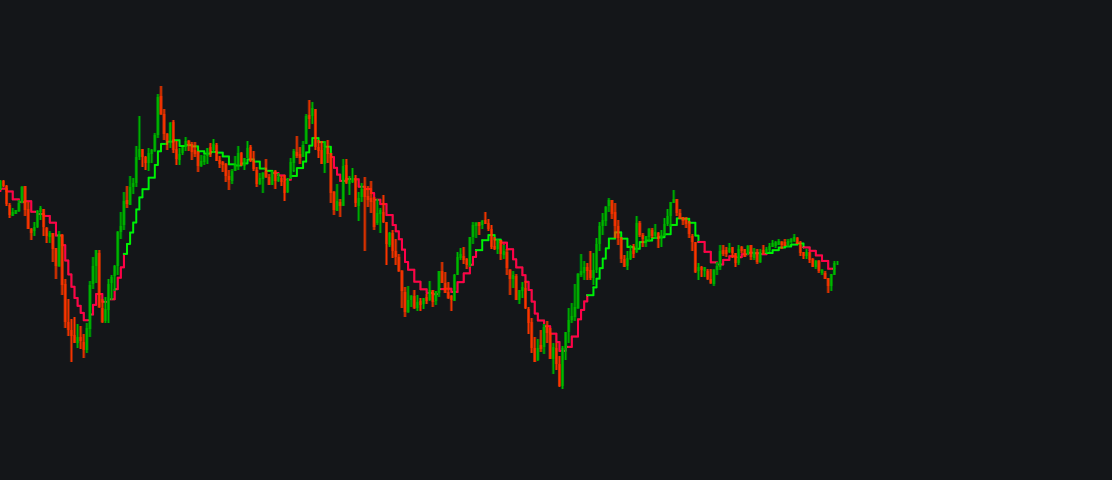
SM ENTRY - Precision entry signals with a flat-price filter Most indicators only tell you which way the market is going. SM ENTRY is built around a different question: when is the right moment to enter? It marks the exact candle where momentum shifts, an…
/indicator/sm-entry-59
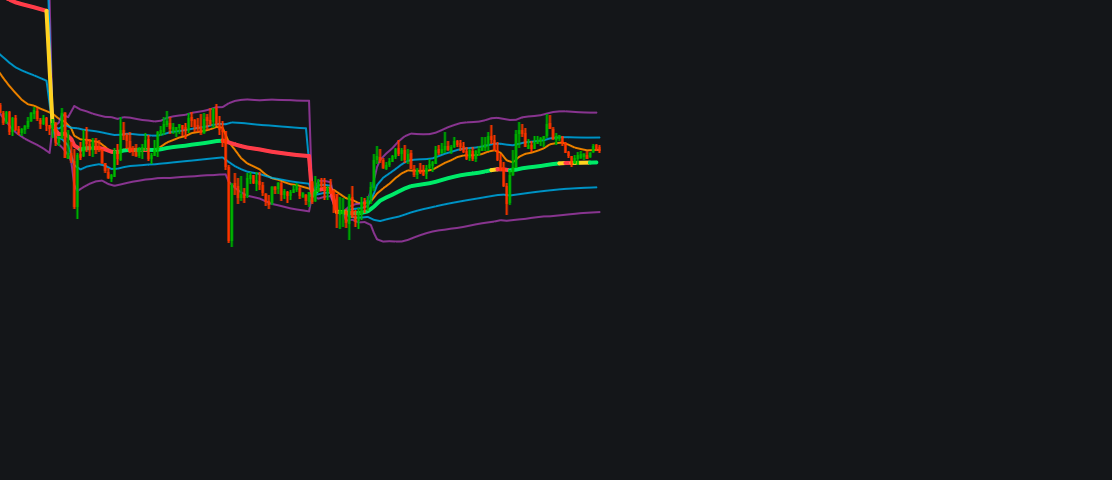
VWAP + SD Bands + EMA 20image
VWAP + SD Bands + EMA 20
Session VWAP + ±1/±2 SD Institutional Bands + EMA 20 is a clean, institutional-grade overlay indicator designed for intraday traders, scalpers, and trend followers across Gold (XAU/USD), Forex, Indices, and Crypto. KEY FEATURES: 1. Dynamic Trend-Biased S…
/indicator/vwap-sd-bands-ema-20-17
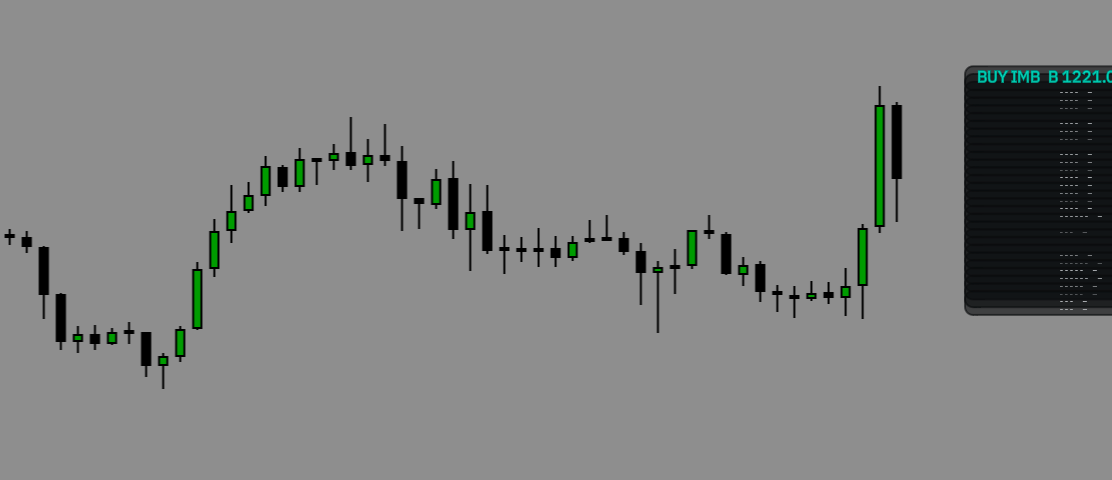
Jake Orderflow Profile — Imbalance & Zone Trackingimage
Jake Orderflow Profile — Imbalance & Zone Tracking
Jake Orderflow Profile displays a detailed, chart-anchored price ladder with estimated buy/sell volume, imbalance highlighting, and zone-entry tracking. Each row follows its price level as you scroll or zoom. Switching timeframes recalculates the profile…
/indicator/jake-orderflow-profile-imbalance-zone-tracking-73
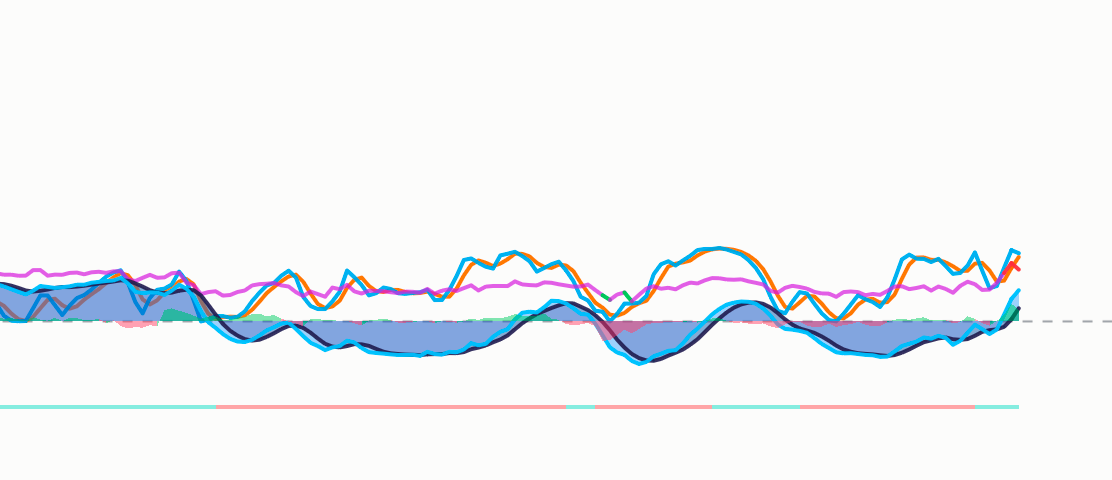
Zalen Wave Oscillatorimage
Zalen Wave Oscillator
Zalen Wave Oscillator  is a momentum pane built around an adaptive wave engine. It is designed as the companion of Zalen WaveTrend Overlay: with Auto settings on, both use the same engine, so the dots in this pane land on the same candles as the Overlay'…
/indicator/zalen-wave-oscillator-67
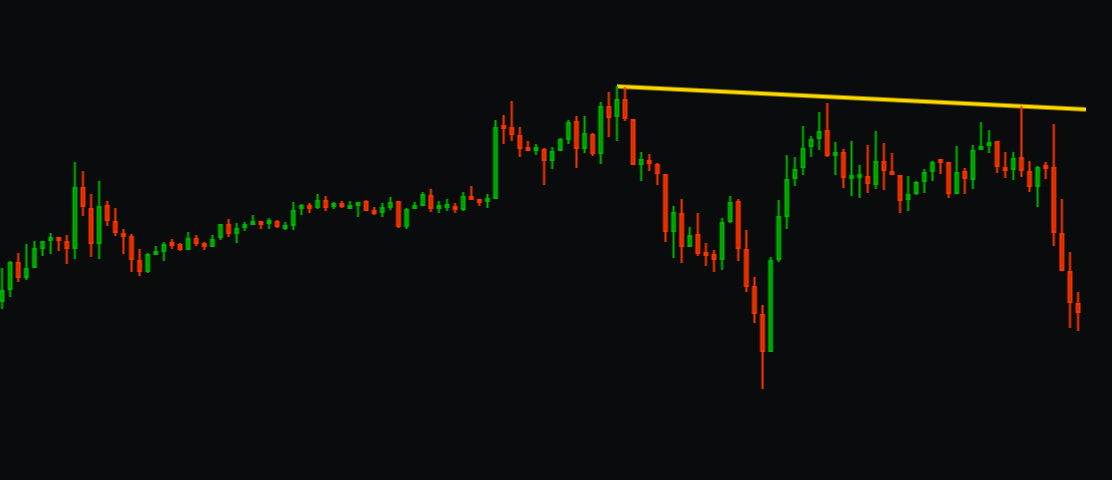
Abu Laith Downtrend linesimage
Abu Laith Downtrend lines
How to use it The line marks where sellers have been stepping in. A breakout means that pressure has eased. It is not a buy signal on its own. Combine it with your own analysis: trend, volume, support/resistance and market context. Works on stocks, ETFs…
/indicator/abu-laith-downtrend-lines-17