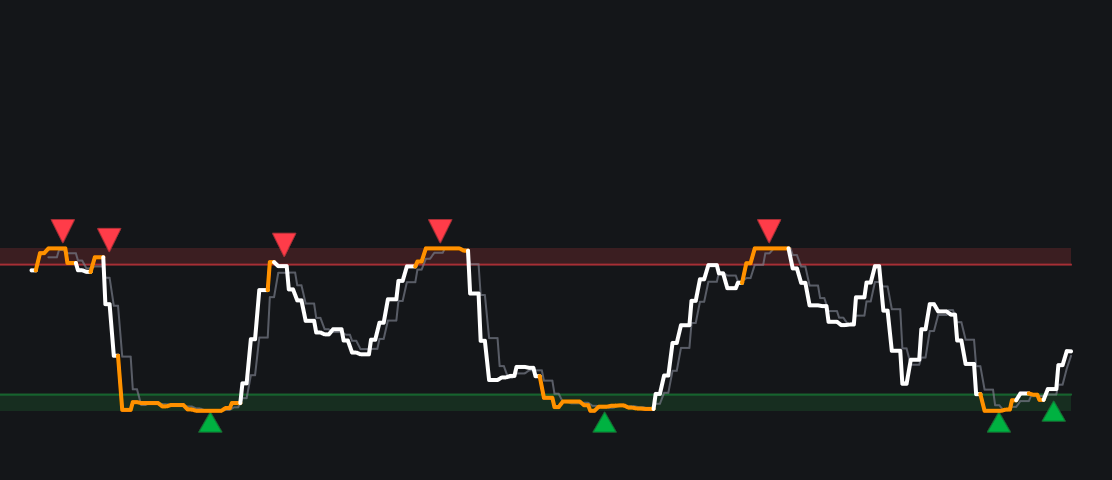
BTC RSI [METIS]image
BTC RSI [METIS]
BTC RSI [METIS] Monthly Stochastic RSI with Buy and Sell Zones This indicator calculates the Stochastic RSI on a monthly timeframe and highlights extreme zones where Bitcoin’s historical lows and cycle peaks have occurred. It marks the extreme point with…
/indicator/btc-rsi-metis-59
OB Reaction Oddsimage
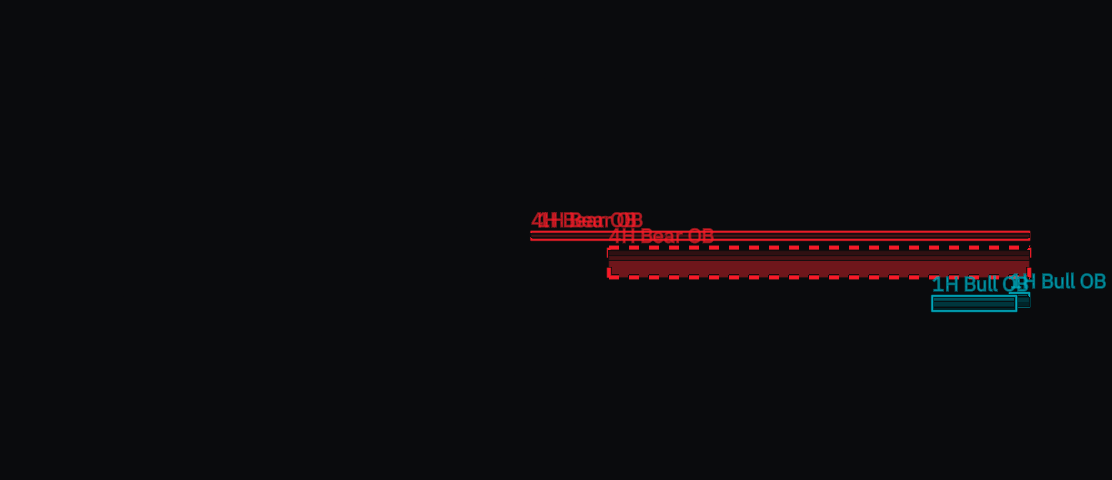
OB Reaction Odds
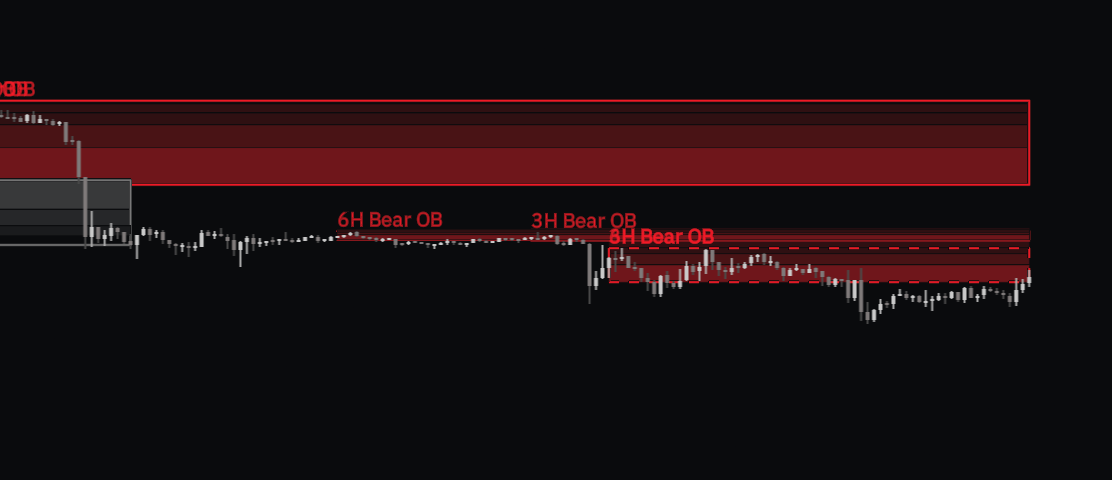
OB Reaction Odds shows 15M / 30M / 1H / 4H order blocks together with statistics on how price has historically treated them (Bybit BTCUSDT 5m, Oct 2022 – Nov 2026, about 10,000 first touches). Designed for the 5m chart and also works on 15m (for 30m / 1h…
/indicator/ob-reaction-odds-35
OB Reaction Odds HTFimage
OB Reaction Odds HTF
OB Reaction Odds HTF shows order blocks scaled to your chart timeframe, together with statistics on how price has historically treated them (Bybit BTCUSDT, 1h candles since March 2020 and 5m candles since Oct 2022). Use it on a 30m, 1h or 4h chart. • 30m…
/indicator/ob-reaction-odds-htf-25
Quarterly Theory Cycle [DinoArm]image
Quarterly Theory Cycle [DinoArm]
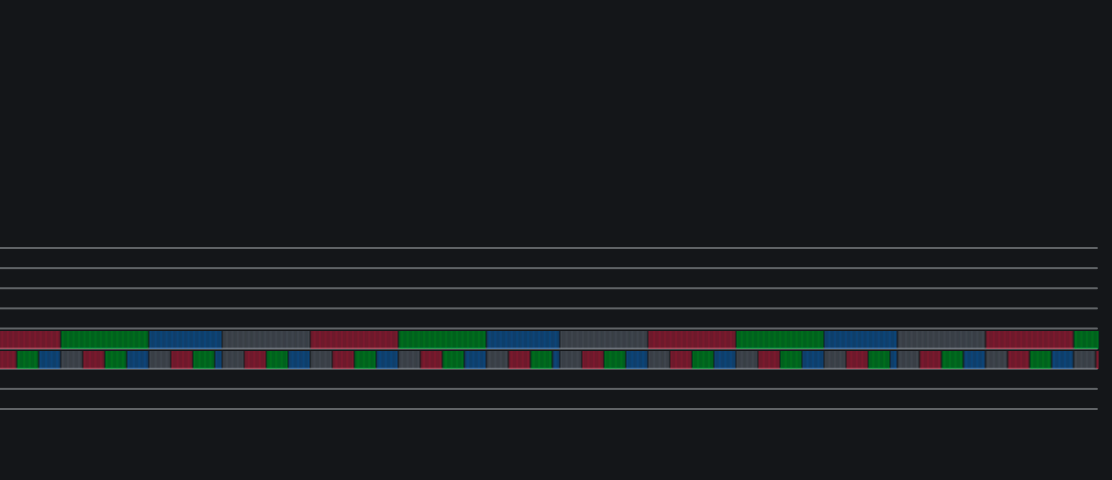
Introduction and Acknowledgements The Quarterly Theory tool encompasses the cyclical Time aspect of the markets as studied and developed by Daye (traderdaye on Twitter). I am not the creator of this Theory, and I do not hold the answer to all the questio…
/indicator/quarterly-theory-cycle-dinoarm-52
BTC Cycle Map + Halvings [METIS]image
BTC Cycle Map + Halvings [METIS]
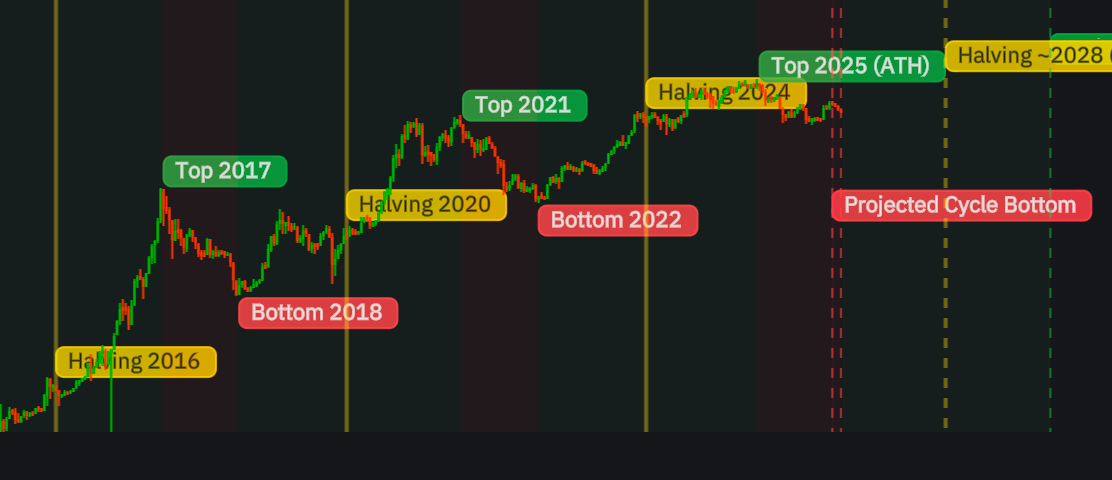
BTC Cycle Map + Halvings [METIS] Bitcoin Market Cycles and Halving Chart This indicator colors the chart according to market phases: bearish phases from peak to trough and bullish phases from trough to peak. It marks halvings, peaks, and troughs from pas…
/indicator/btc-cycle-map-halvings-metis-60
ETH Cycle Map [METIS]image
ETH Cycle Map [METIS]
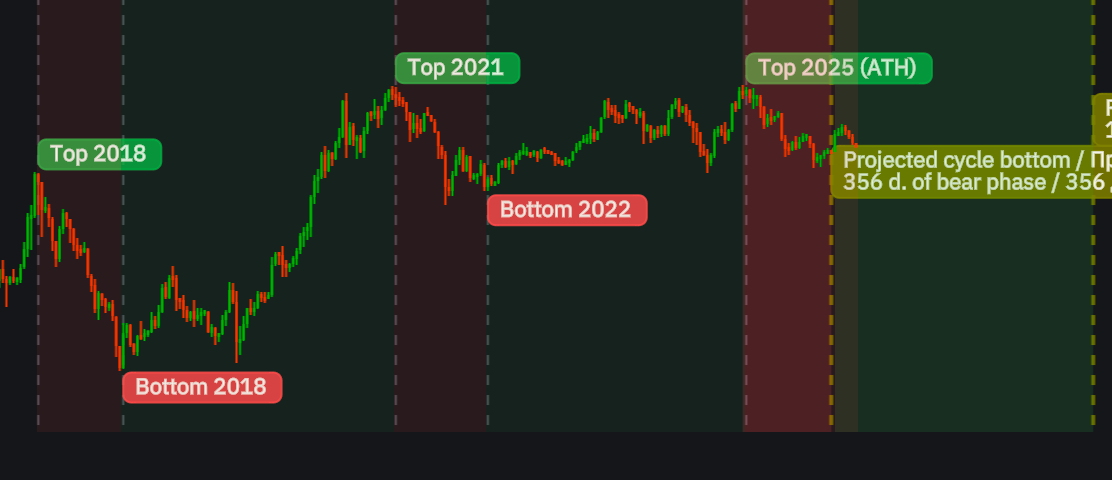
ETH Cycle Map [METIS] Ethereum Market Cycle Chart This indicator displays the bull and bear phases of past cycles on the Ethereum chart, marks their peaks and troughs, and forecasts the end of the current bear phase and the start of the next bull market.…
/indicator/eth-cycle-map-metis-75